Introducing LaunchPulse: analytics for products that just shipped
Why we built a $5 analytics dashboard for indie founders, and what it does (and deliberately doesn't do).
Every founder we know has the same tab open the morning after a launch: an analytics dashboard they don’t fully understand, showing numbers they’re not sure they can trust, for a product with maybe forty visitors.
That’s the moment LaunchPulse was built for.
The problem with “real” analytics
Big analytics suites are built for teams with data analysts, event taxonomies, and a quarterly OKR review. When you’re one person with a landing page, a Stripe link, and a waitlist, you need answers to exactly three questions:
- Is anyone coming? — traffic, and where it comes from.
- Is anyone signing up? — conversions from visit to signup.
- Is anyone actually using it? — activation: did they reach the moment your product is for?
Everything else is noise you’ll care about later, if you’re lucky enough to have a “later.”
What LaunchPulse does
One dashboard per project — the Pulse — with a funnel that goes Visit → Signup → First Value, your top traffic sources, a live activity feed, and a weekly email that tells you what changed. That’s the front page, on purpose.
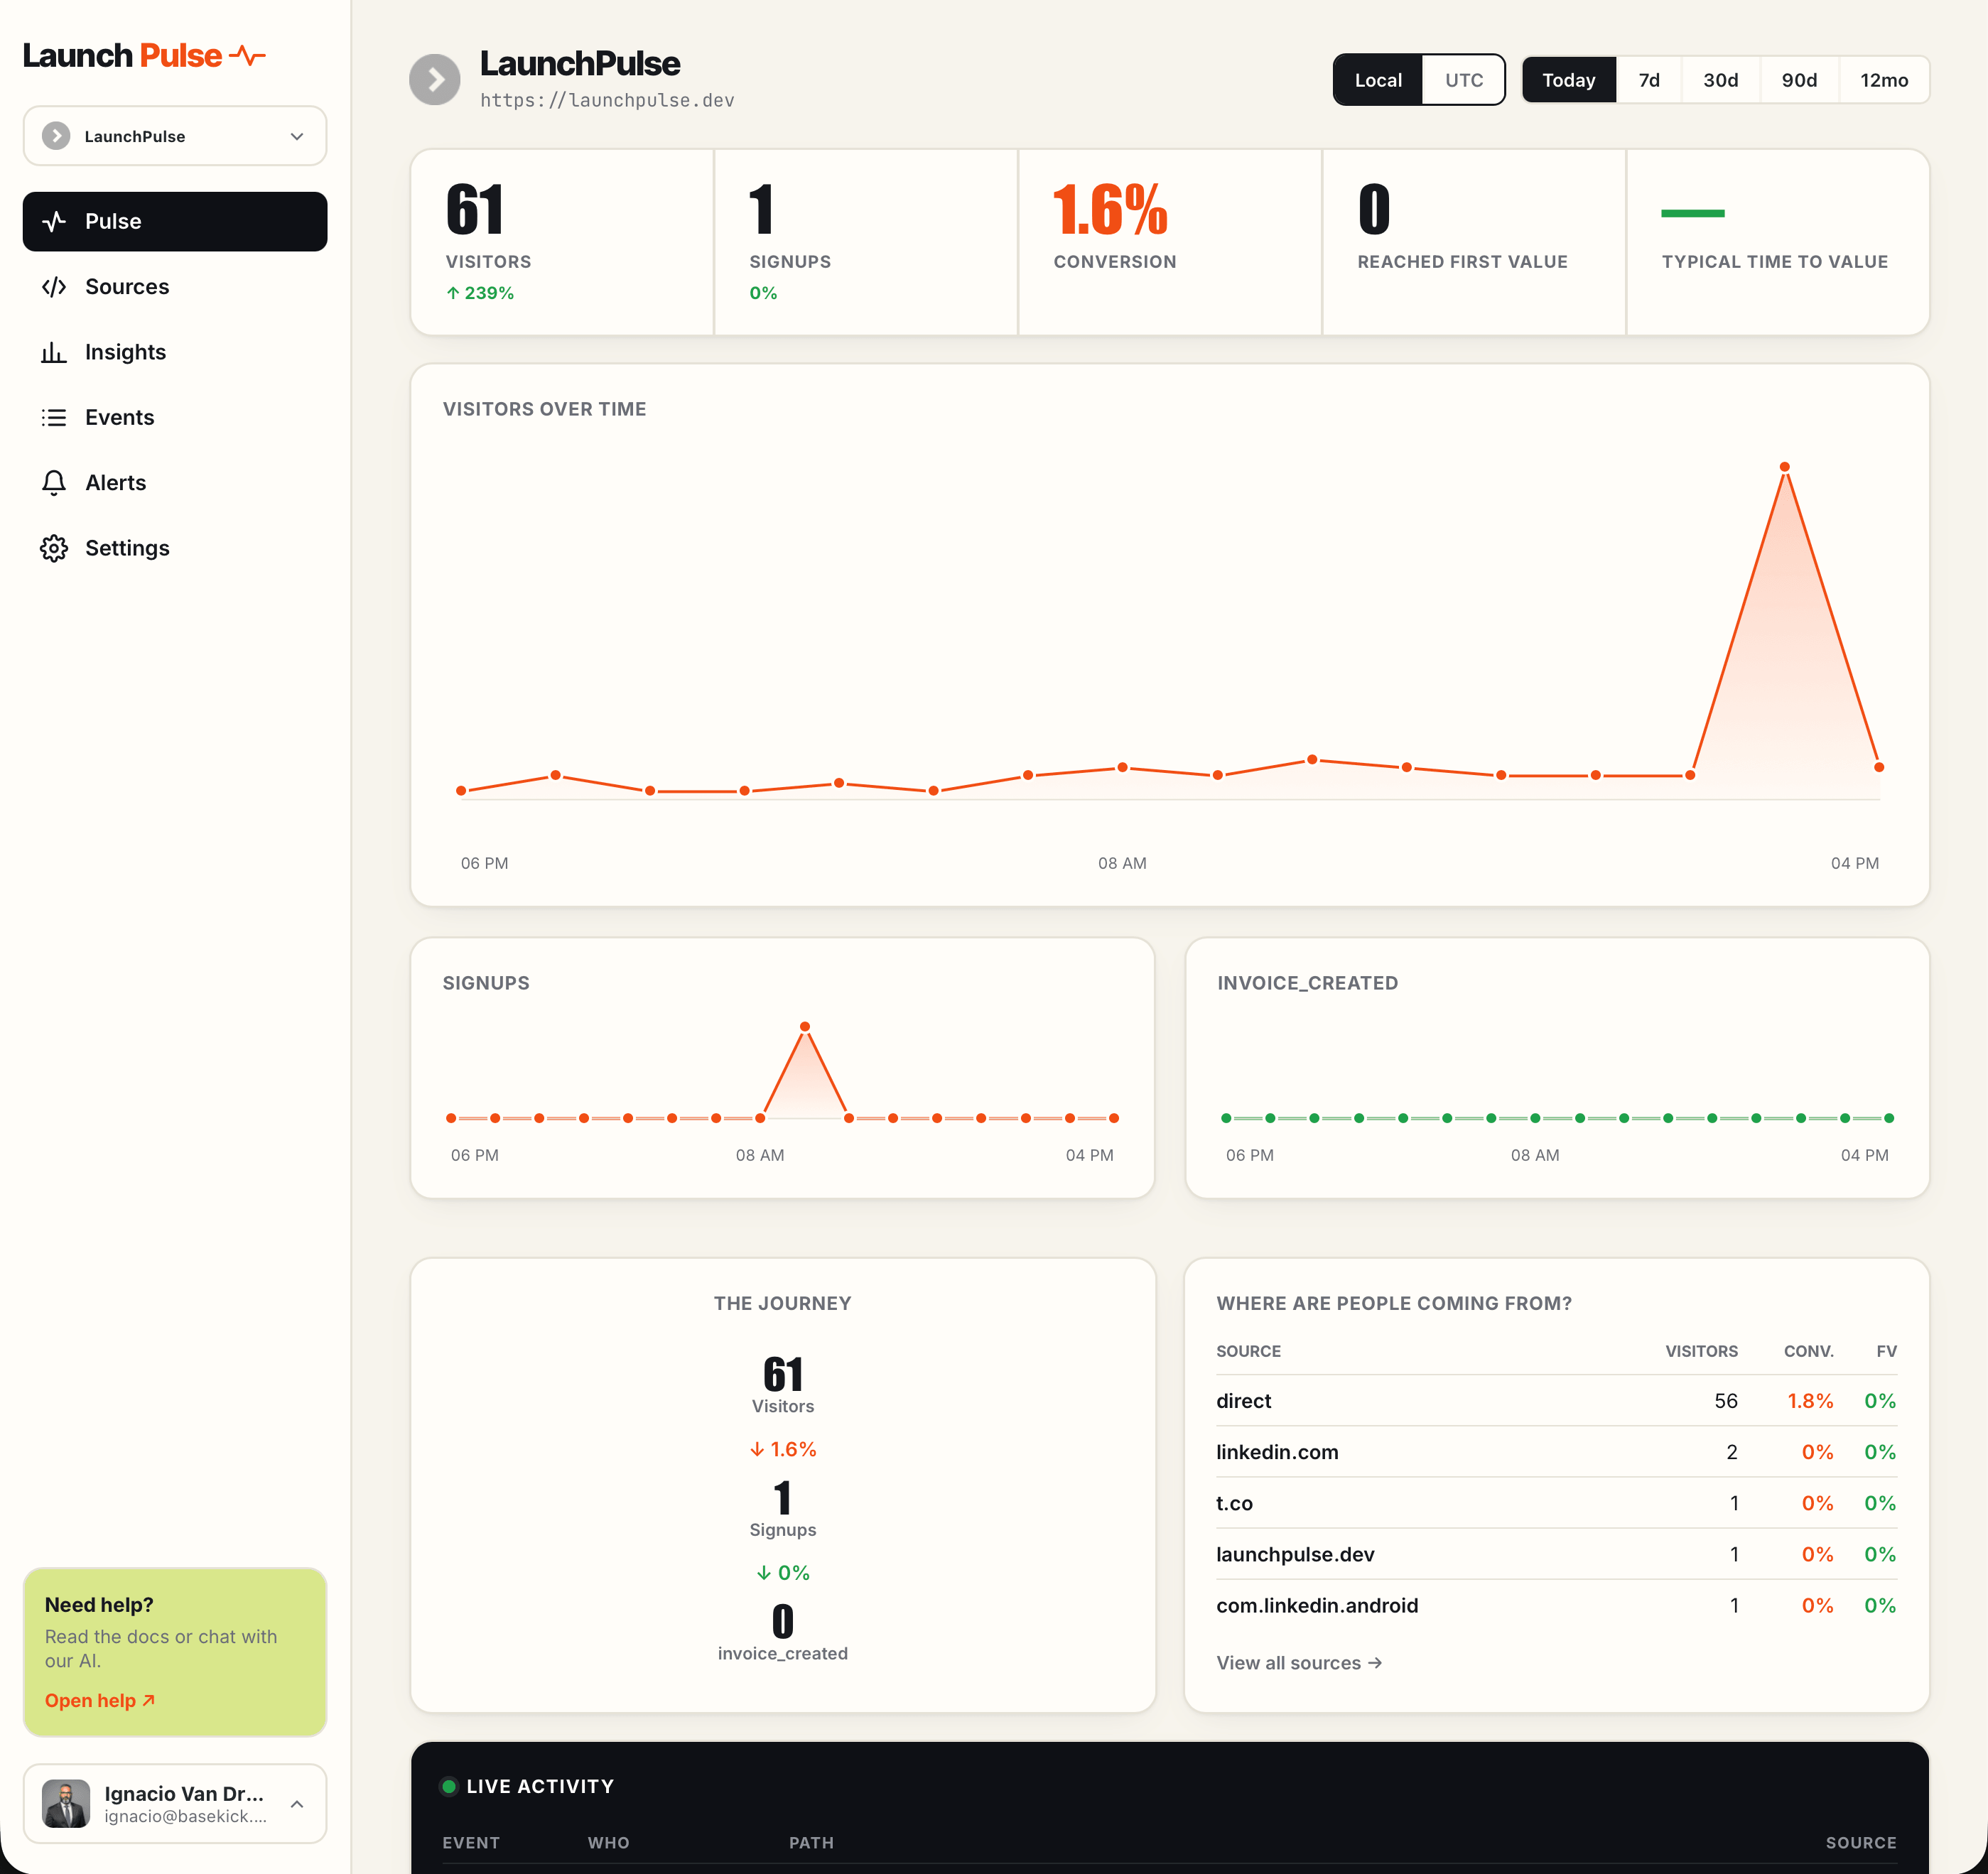
That screenshot is our own dashboard, on the day we wrote this — 61 visitors, one signup, a 1.6% conversion rate. We could have mocked up prettier numbers. This is more useful: it’s what the product looks like at the scale you’ll actually be using it.
Install it in one prompt
If you build with an AI coding agent, setup is a copy-paste. The install screen generates a ready-made prompt with your public key, your framework, and the events you just configured already filled in:
Install LaunchPulse analytics in this Next.js project. Public key: lp_pub_…
- Add the LaunchPulse tracker so pageviews are tracked automatically…
- Call lp.track(“account_created”) ONLY after the action truly succeeds…
Paste that into Claude Code or Cursor and it wires the tracking, in the right places, with your event names — not generic boilerplate you have to correct afterwards.
Prefer to do it yourself? It’s a script tag:
<script src="https://collector.launchpulse.dev/lp.js"></script>
<script>LaunchPulse.init("lp_pub_yourkey");</script>
or an npm package for React, Next.js, Vue, and SvelteKit:
npm i @basekick-labs/launchpulsePageviews start flowing immediately. Then you tell LaunchPulse two things — what counts as a signup, and what counts as first value (the moment someone actually gets something out of your product) — and the funnel fills itself in.
Change your mind later, for free
Here’s the part we’re quietest about and proudest of: your event definitions are applied when you read your data, not when you send it.
Decide next month that “signup” should have meant account_created instead of email_submitted? Change it in settings and your entire history is re-read with the new definition. No re-instrumenting, no migration, no gap in the charts. Same for aliases when your code and your dashboard disagree about a name.
That’s unusual, and it exists because founders rename things constantly in the first months. Your analytics shouldn’t punish you for it.
Power without the setup tax
Behind the Pulse there’s more, and none of it is required:
- Events as a log stream — every event, filterable, with server-side pattern grouping so
/orders/8f2a…and/orders/91c…collapse into one line - Custom dashboards — drag-and-resize charts you build yourself, broken down by browser, OS, country, campaign, or any UTM
- Alerts — get an email or a webhook when something spikes, or when something stops (“no signups in 24 hours”). Fires once when it breaks, once when it recovers — no repeat spam.
Built bilingual from day one
LaunchPulse speaks English and Spanish everywhere — dashboard, reports, docs, and this blog. Not a translated afterthought: both languages are first-class, because founders ship from everywhere.
$5. That’s it.
One plan, up to 3 projects, 1 million events a month, billed $5 monthly or $39 a year. Fourteen-day trial, no card required. Cancel anytime — and if you do, we keep collecting your data, so your history is intact whenever you come back.
If your product grows past that, congratulations — you’ll have outgrown us for the best possible reason.
Start here or read the docs — and tell us what you’re shipping at hello@launchpulse.dev.